Dashboard: inspect the pipeline
Once you have run a pipeline locally, you can launch a web app that displays detailed information about your pipeline. This app is built with the marimo Python notebook framework. For this to work, you will need to have the dlt[workspace] package installed.
The dashboard works with all destinations that are supported by the dataset interface. Vector databases are not supported at this moment. However, you can still inspect metadata such as run traces, schemas, and pipeline state.
Overview
The dashboard is a locally hosted application built on marimo. It comes preconfigured with the key pipeline metadata and operational context you need to review pipeline health and validate data quality.
With the dashboard, you can:
- Inspect pipeline metadata
- Query data in the destination
- Review traces and exceptions
- Check the history of pipeline runs
- Verify incremental loading behavior
You can also customize the dashboard and create a personalized version tailored to your workflow.
Quick start
You need to install dlt workspace using the following command:
pip install "dlt[workspace]"
Launching the dashboard
You can start the dashboard with an overview of all locally found pipelines with:
dlt dashboard
You can use the show CLI command
with your pipeline name to directly jump to the dashboard page of this pipeline:
dlt pipeline {pipeline_name} show
Use the pipeline name you defined in your Python code with the pipeline_name argument. If you are unsure, you can use the dlt pipeline --list command to list all pipelines.
Credentials
dlt will resolve your destination credentials from:
secrets.tomlandconfig.tomlin the.dltfolder of the current working directory (CWD), which is the directory you started the dashboard fromsecrets.tomlandconfig.tomlin the globaldltfolder at~/.dlt.- Environment variables
It is best to run the dashboard from the same folder where you ran your pipeline, or to keep your credentials in the global folder.
dlt will NOT be able to pick up any credentials that you have configured in your code, since the dlt dashboard app runs independently of any pipeline scripts you have.
Using the dashboard
This section is a development checklist for validating a new REST API pipeline using the dashboard.
- Row counts look right? → Dataset Browser
- Incremental cursor advancing? → Pipeline State
- Schema structure correct? → Schema Explorer
- Business entities present? → Dataset Browser
- Data types correct? → Schema Explorer
1) Am I grabbing data correctly?
Pagination sanity
What to look for
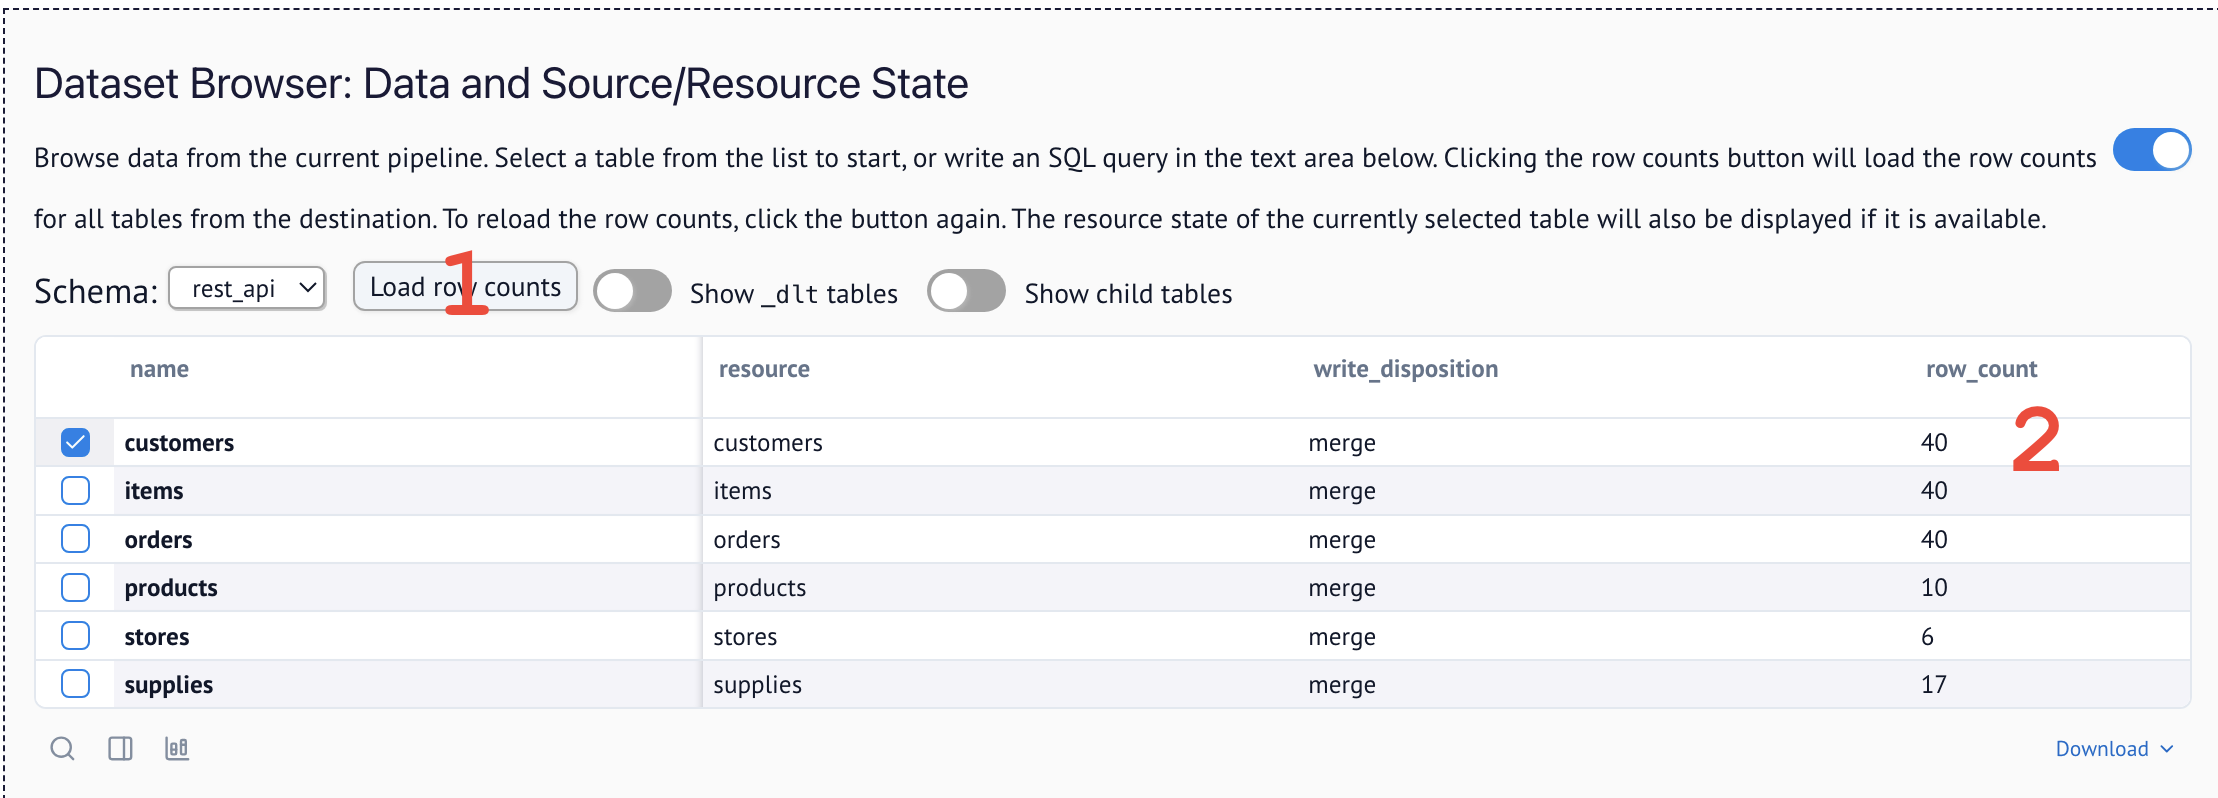
- If your first successful run shows a suspiciously round count (for example, 10 / 20 / 100) for a resource whose page size matches that number, you probably captured only page 1.
- Cross-check the source's expected volume (API docs, admin UI, or a known "ground truth") vs. what landed.
To do so, navigate to the Dataset Browser and load row counts:
Typical failure modes
- The wrong paginator pattern was chosen vs. the API docs (cursor vs. offset vs. page/size).
- The API supports multiple pagination styles per endpoint and you implemented the wrong one.
What to do: reread the endpoint's official documentation (or ask your agent to do so) and confirm the exact pagination contract (parameter names, response fields, end-of-data signal).
2) Am I loading data correctly?
Full loads (non-incremental)
Using replace write disposition is slower but simpler. If you are using it to do full loads, you do not need to troubleshoot incremental loading.
Incremental loads
-
Run multiple increments and check that each run only brings the delta.
-
Validate in two places:
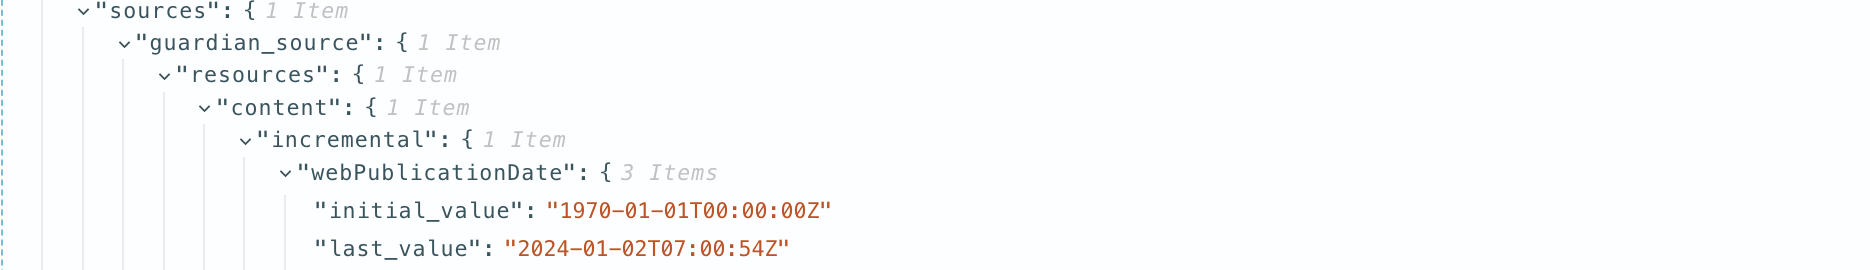
- Pipeline State: the resource's cursor (for example,
last_extracted_at/last_value) should advance to the end of the previous run. This is how it looks in the raw pipeline state:
- Pipeline Loads row counts: Check how many rows each run loaded by running a query in the Dataset Browser:
SELECT _dlt_load_id, COUNT(*) FROM items GROUP BY 1 - Pipeline State: the resource's cursor (for example,
-
Optionally, check for continuity in the data. If you have a time axis or incremental IDs with normal distribution, plot them on a line chart to spot any anomalies. For easy plotting, we suggest using our integrated marimo notebook.
3) Is my normalized schema the one I actually want?
We generally recommend you let dlt fully manage your schema for two reasons: you do less work, and the entire schema is discovered and explicit. But sometimes your data might also contain metadata that is not useful and should be removed.
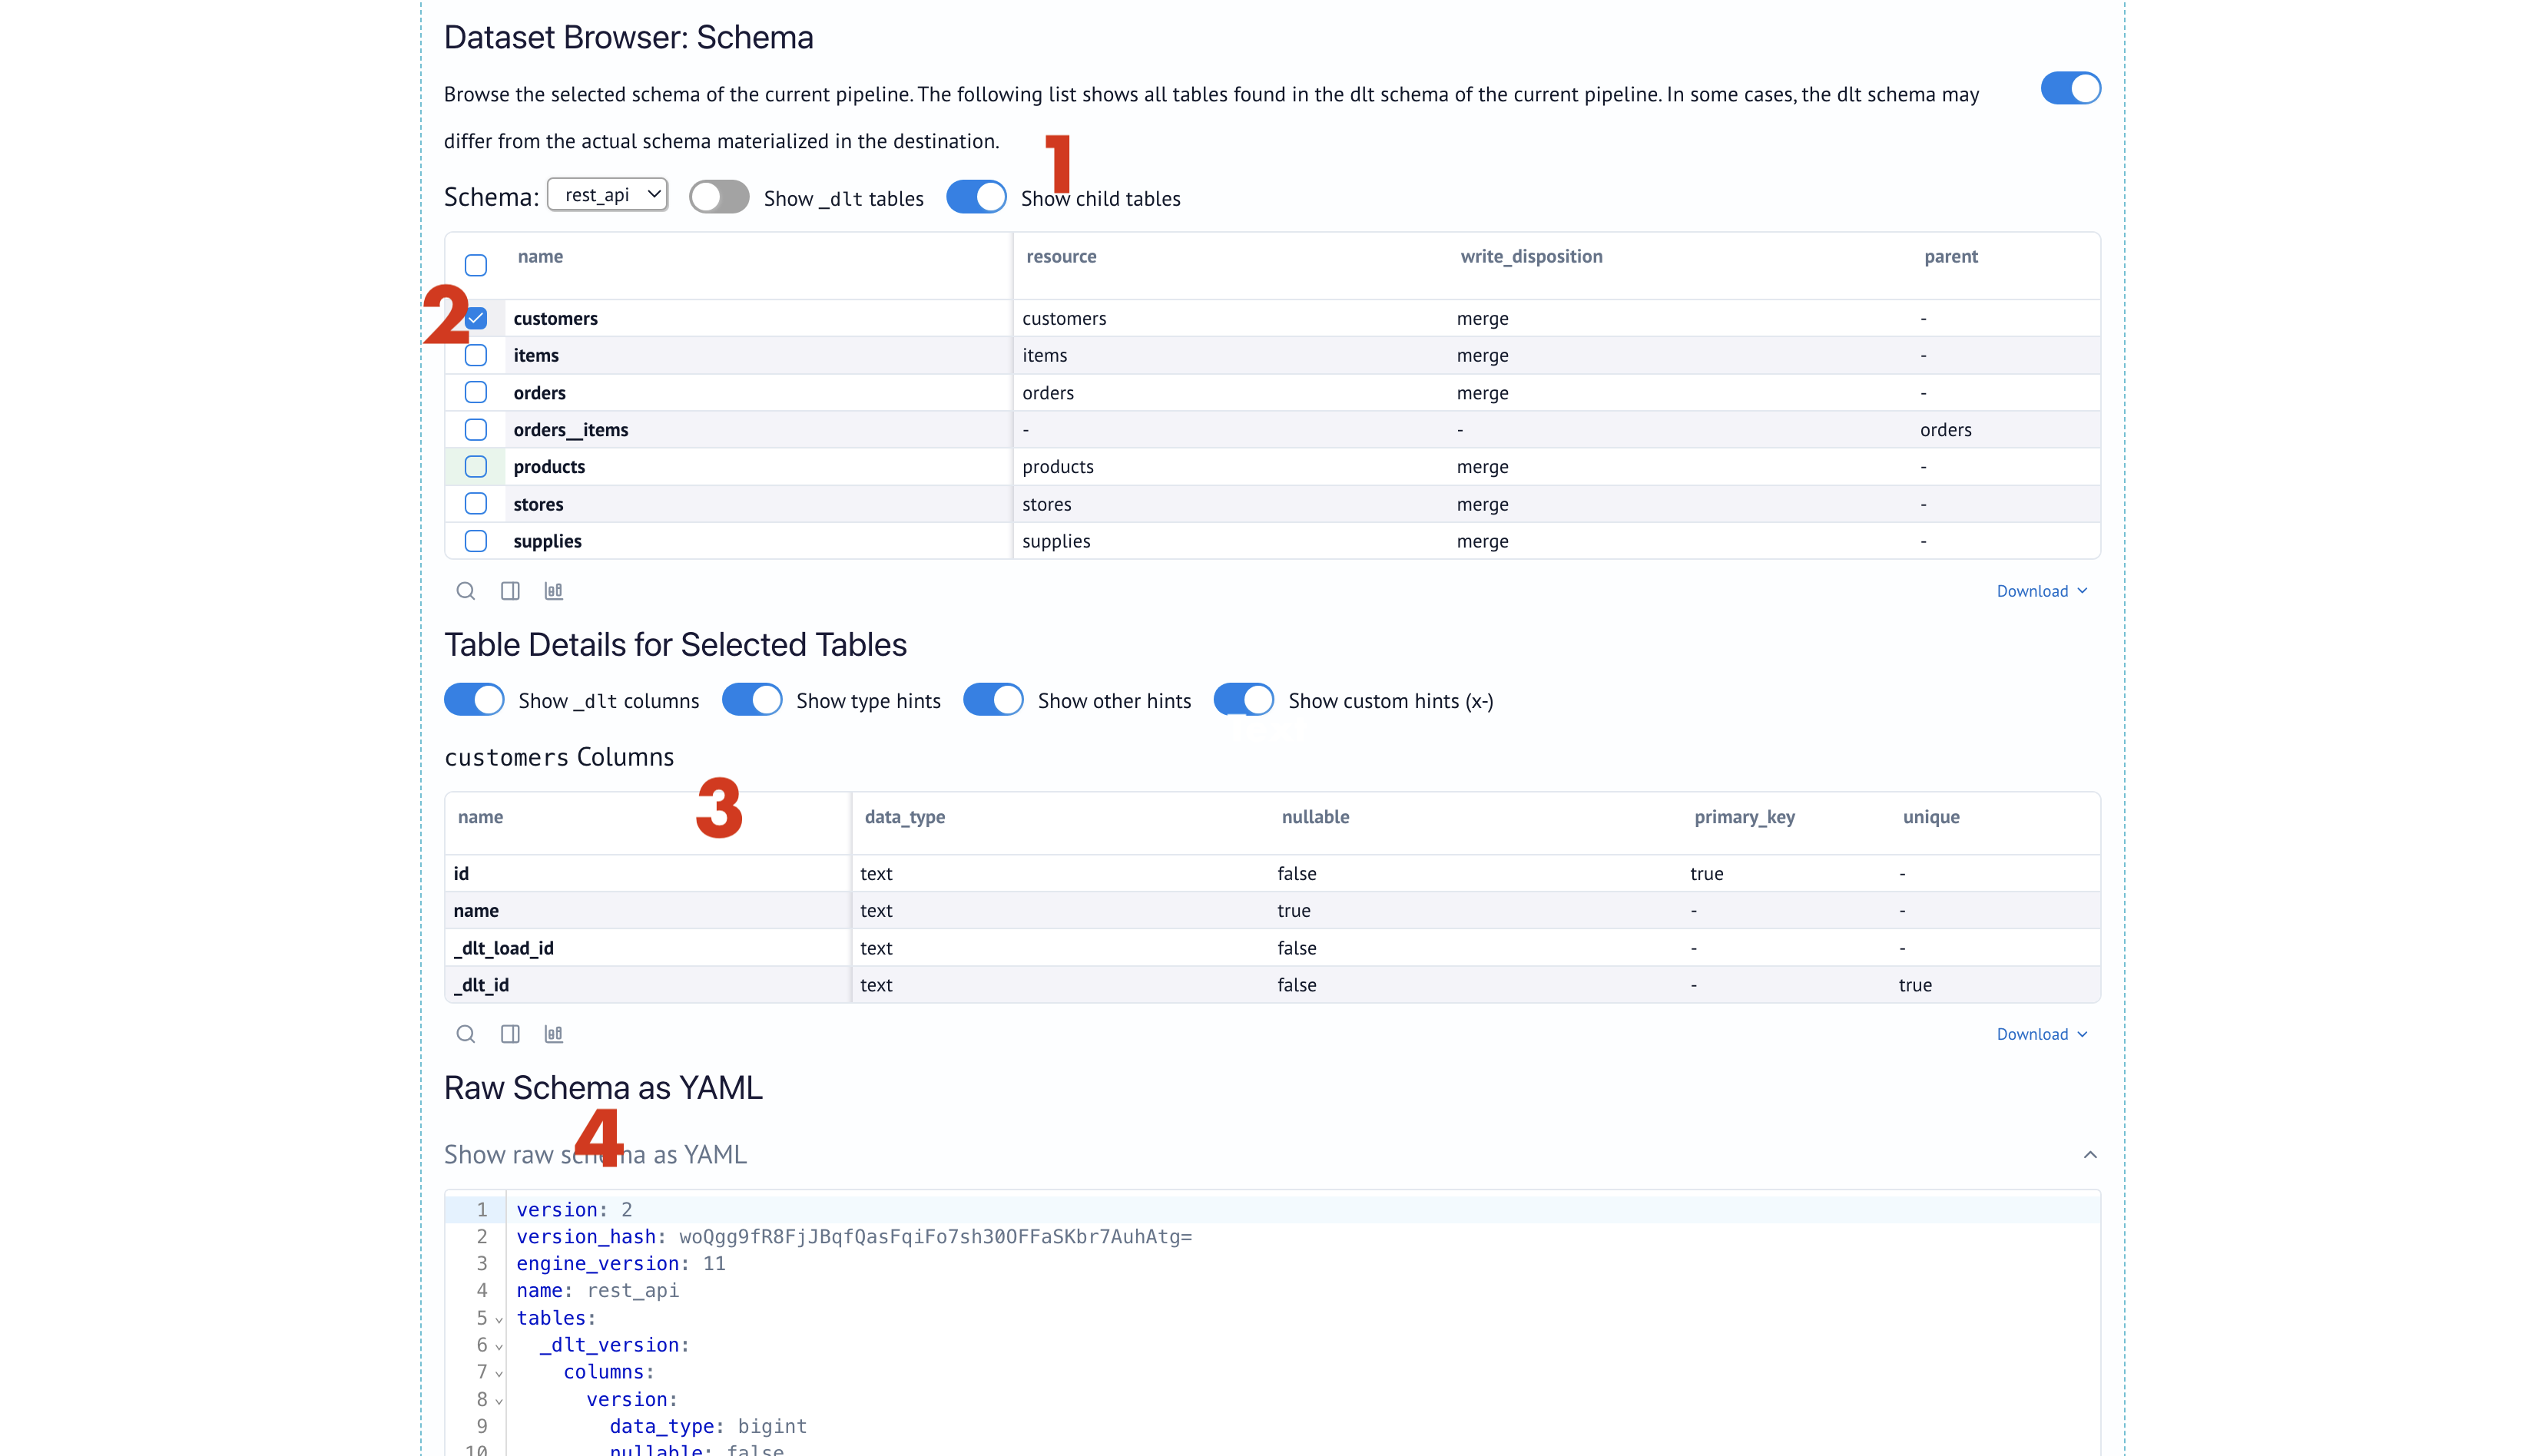
To inspect the schema, check the Schema Explorer:
Options to change your schema
- Filter at extraction to drop unneeded fields
- Reduce unnesting or keep some payloads as complex (nested) types if your destination supports it.
Example: Using json type with REST API:
import dlt
from dlt.sources.rest_api import rest_api_source, RESTAPIConfig

def example_complex_unnesting():
    # Default behavior: dlt creates 'orders__items' child table.
    # Desired behavior: 'items' column in 'orders' table with JSON/Struct type.

    config: RESTAPIConfig = {
        "client": {
            "base_url": "https://jaffle-shop.dlthub.com/api/v1/",
            "paginator": {
                "type": "page_number",
                "page_param": "page",
                "base_page": 1,
                "maximum_page": 1,  # Just 1 page for testing
                "total_path": None
            }
        },
        "resources": [
            {
                "name": "orders_complex_test",
                "endpoint": {
                    "path": "orders",
                    "params": {"page_size": 5}
                },
                "write_disposition": "replace",  # clean start
                "columns": {
                    "items": {"data_type": "json"}  # keep this table nested
                }
            }
        ]
    }

    pipeline = dlt.pipeline(
        pipeline_name="test_complex_pipeline",
        destination="duckdb",
        dataset_name="test_data"
    )

    source = rest_api_source(config)
    load_info = pipeline.run(source)
4) Do I have the right business data?
What to look for
Open the Dataset Browser and run a query to see what you actually have:
SELECT * FROM {your_table} LIMIT 10
- Do the tables contain the entities and attributes your use case needs?
- Are key columns present (IDs, timestamps, status fields)?
- Is the data complete or are important fields showing up as
NULL?
Typical failure modes
- The API returns a summary view by default; you need extra parameters (e.g.,
expand,include=changes,since=) to get full details. - Related data lives in separate endpoints that you haven't added yet (e.g., orders exist but order line items are a different endpoint).
- PII columns (emails, phones, names) are present and need to be hashed or removed before analytics.
What to do
- Check the API docs for expansion parameters that return nested/related data.
- Add additional endpoints to your source if you need related entities.
- Use
add_mapto hash PII or reshape records before loading.
Use the Dataset Browser to explore the data, or the marimo notebook for more complex analysis.
5) Are my data types correct?
What to look for
Open the Schema Explorer and check the data_type column for each field:
- Numbers should be
bigintordouble, nottext - Dates should be
timestampordate, nottext - Boolean fields should be
bool, nottext
Typical failure modes
- Numbers arrive as strings (
"amount": "100.00") because the API returns them quoted. - Timestamps in non-standard formats (e.g.,
"12/25/2024"or Unix epochs) aren't auto-detected. - Boolean values come as
"true"/"false"strings or0/1integers.
What to do
- Enable additional autodetectors to catch more types automatically. Add to your config:
[schema]
detections = ["iso_timestamp", "timestamp", "large_integer"]
- Transform at extraction using
add_mapto cast values before they hit the schema.
Docs:
Understanding the dashboard
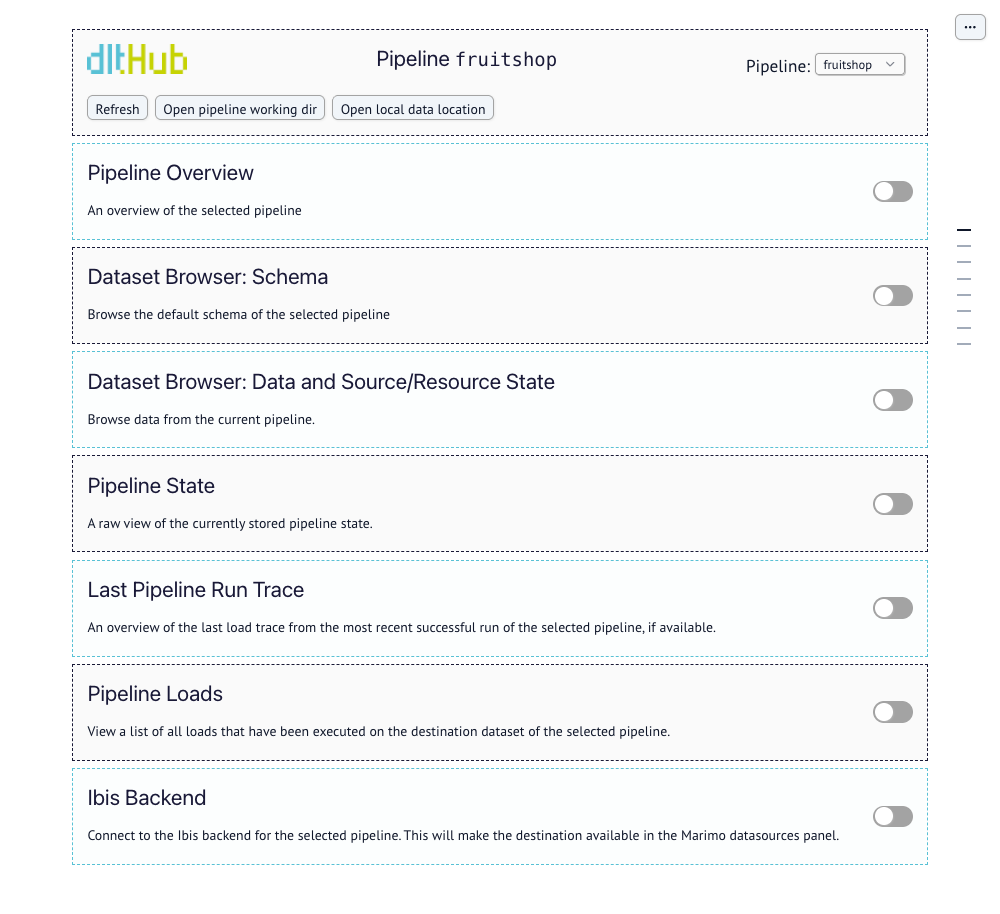
The dashboard app should mostly be self-explanatory. Go to the section that corresponds to your task and click the toggle to open and use it. The dashboard app also refreshes all data when a new local pipeline run is detected for your selected pipeline. You can switch between pipelines on your machine using the pipeline dropdown in the top-right.
The following sections are available:
Pipeline info
The overview section serves as a health check for your pipeline. If a run fails, this is where dlt surfaces the exception details and stack traces. Review last executed to ensure the pipeline is running on the expected schedule or has recently completed a load.
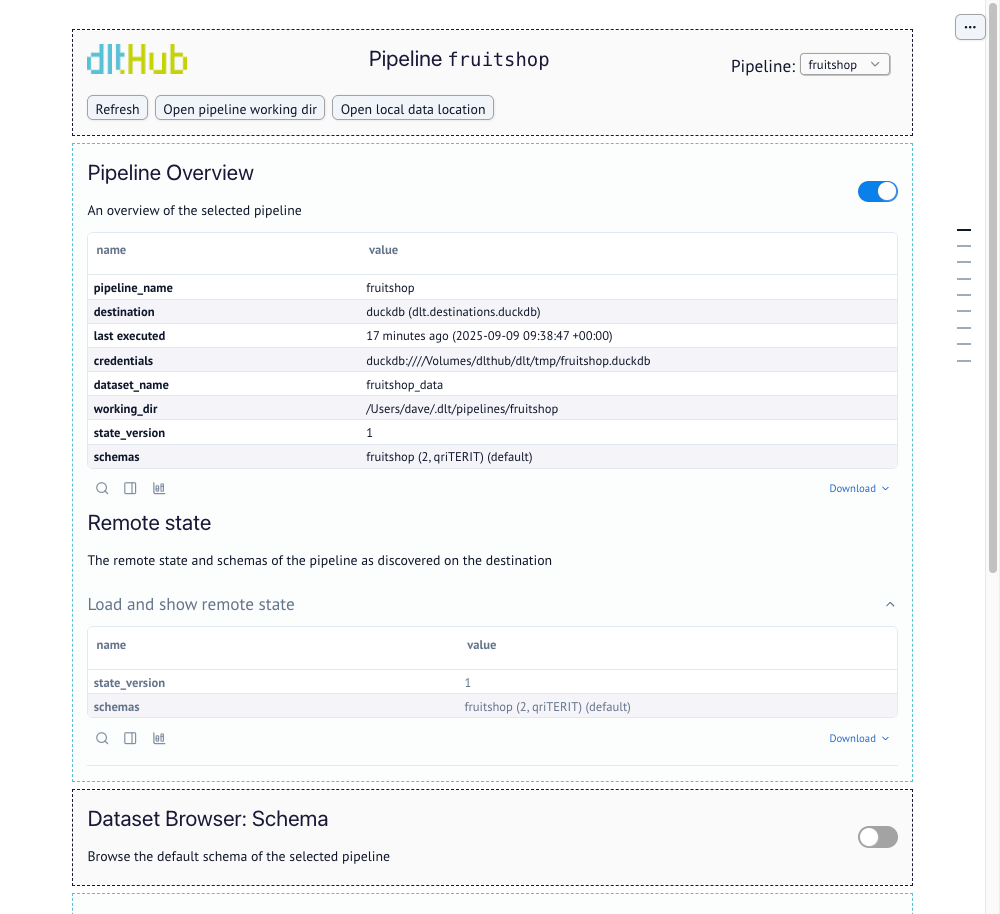
-
Last executed: The timestamp of the last successful run. This is the primary indicator that your pipeline is running on schedule.
-
Credentials: Displays the connection string or file path currently being used to reach the destination.
-
Schemas: Lists all schemas associated with the pipeline name.
Remote state
This section queries and displays the state information that has been successfully committed to the destination, confirming what is stored outside the local working directory.
- The
state_versionshown here should generally match thestate_versionin the Pipeline Overview if the last run was successful. - Click
Load and show remote stateto query the destination and retrieve this information.
Schema explorer
The schema browser allows you to dive deep into your pipeline's schemas and see all tables, columns, and type hints. This view is based on the dlt schema, the internal blueprint used to create and update tables in your destination.
When loading data for the first time, use this section to:
- Click
Show child tablesto ensure that nested data is unnested successfully and at the required level. - Inspect the type hints specifically, making sure that timestamps and large numbers are captured in the right way.
- Raw Schema as YAML can be exported and stored in your git repository as a reference for the dataset schema.

Dataset browser
The dataset browser allows you to query data directly from your destination. You can inspect the state of each of your resources. Click the Load row counts button to refresh the record counts for all tables based on the current destination data.

Querying your dataset
You can use SQL to query your dataset here. Querying the dataset works with all remote and local destinations including Iceberg tables, Delta tables and Filesystem destination. This is what a query on the fruitshop dataset looks like:

All query results are cached. The Query History shows previous runs that benefit from this cache. Click Clear cache to force a fresh execution against the destination. Queries are executed directly on your destination (for example, DuckDB).
Pipeline state
This section displays a raw, JSON view of the currently stored pipeline state. This state is critical for tracking progress, especially for incremental loading logic.

Last run trace
This section provides a detailed overview of the most recent run for the selected pipeline. You can use this for performance tuning and debugging execution issues. It contains the following:
-
Trace Overview This is a summary of the entire run. It shows the full duration, start time, and end time.
-
Execution Context This section details the environment in which the pipeline was executed, including Python and dlt versions and details like operating system (os), CPU count (cpu), and whether it was a CI run (ci_run).
-
Steps Overview
This table breaks down the total duration into the three phases of a dlt pipeline run: extract, normalize, and load.
- Bottleneck Check: Use the duration column to identify performance bottlenecks.
- A long extract time suggests a slow source.
- Long normalize or load times often point to destination performance or data complexity issues.
Deep Dive: you can click on each step to see more specific details like table names, item counts, file sizes, and timestamps for that specific phase.
- Bottleneck Check: Use the duration column to identify performance bottlenecks.
-
Resolved Config Values This section lists the configuration values that were resolved and used during this pipeline run. Use this to ensure your intended config values were correctly picked up, or to find errors where configuration you set up was not used. The values of the resolved configs are not displayed for security reasons.
-
Raw Trace Clicking Show displays the complete trace information (including all sections above) as a raw JSON payload, which can be viewed and downloaded for advanced analysis or error reporting.

Pipeline loads
This section displays a history of all load packages found in the _dlt_loads table. It tracks every load package committed to the destination.
By selecting a specific load, you can:
- See exactly how many rows were added to each specific table in that run.
- View the full schema that resulted from this load.
- Download the raw schema as a YAML file for historical debugging.

Creating your own workspace dashboard
You can eject the code for the workspace dashboard into your current working directory and start editing it to create a custom version that fits your needs. To do this, run the show command with the --edit flag:
dlt pipeline {pipeline_name} show --edit
# or for the overview
dlt dashboard --edit
This will copy the dashboard code to the local folder and start marimo in edit mode. If a local copy already exists, it will not overwrite it but will start it in edit mode.
Below is an example of a custom cell created to verify unique number of rows vs total rows to ensure there are no duplicates in each table after a new run. You can also use the Generate with AI feature to easily add custom cells for your own use cases.
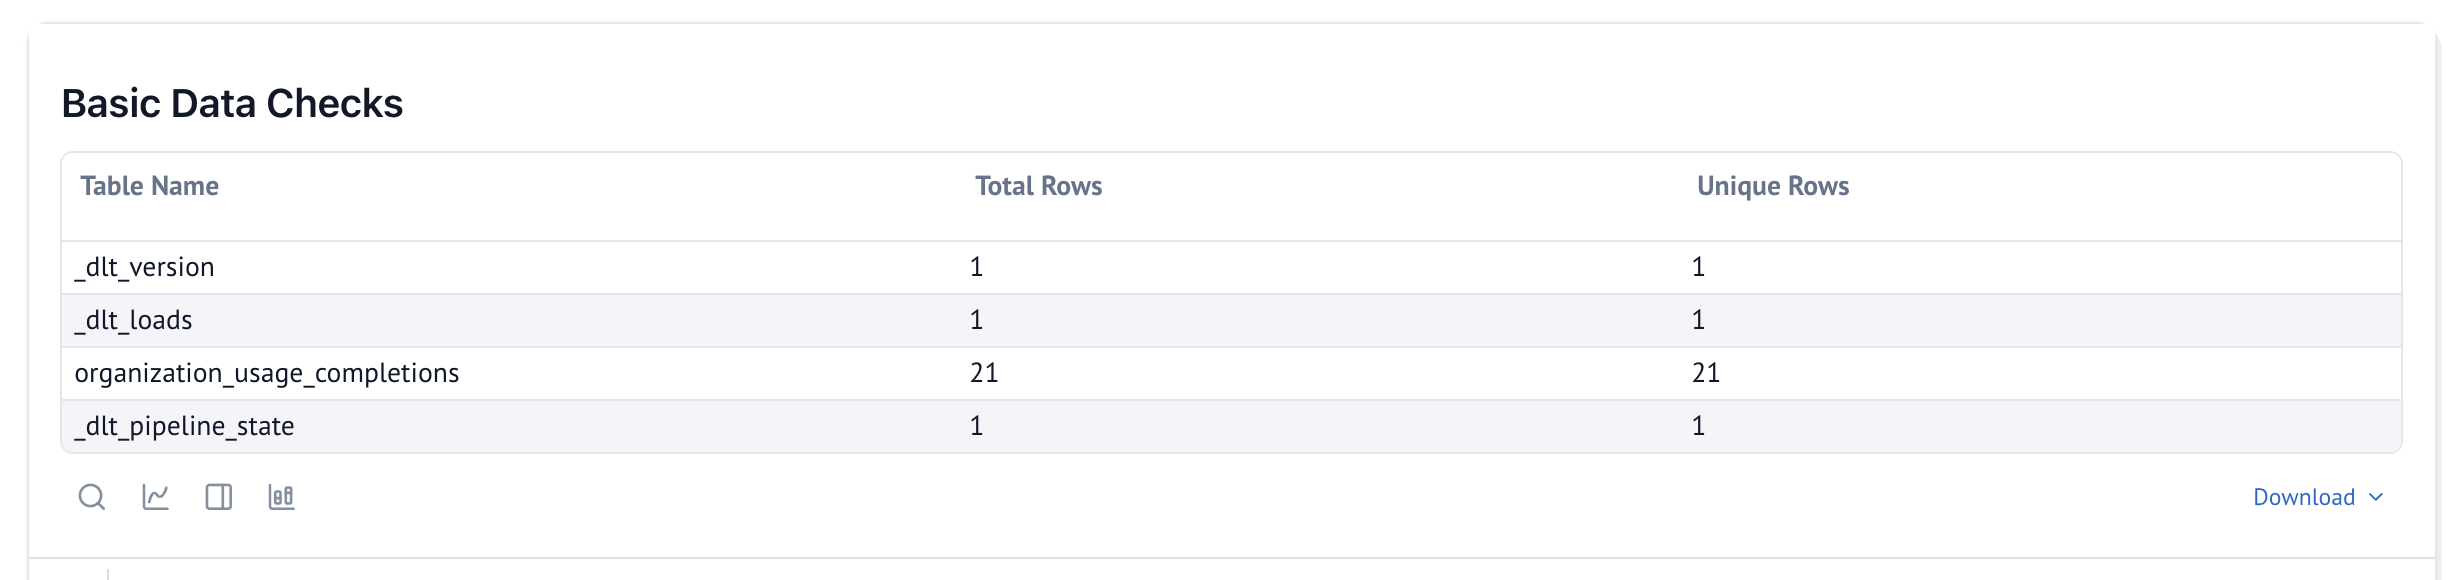
Here is the marimo code used to generate the cell above. mo (marimo), dlt, and utils (from dlt._workspace.helpers.dashboard) are already available in the ejected dashboard:
@app.cell
def _(dlt_pipeline: dlt.Pipeline, dlt_selected_schema_name):
    # Create a list to hold the data for the table
    data = []

    if dlt_pipeline:
        _table_names = dlt_pipeline.schemas[dlt_selected_schema_name].tables.keys()
        for table_name in _table_names:
            _schema_table = dlt_pipeline.schemas[dlt_selected_schema_name].tables[table_name]

            # Fetch column names assuming _schema_table is a dictionary
            column_names = list(_schema_table.get('columns', []))

            if not column_names:
                data.append({"Table Name": table_name, "Total Rows": 0, "Unique Rows": "N/A"})
                continue

            # Construct the SQL query to count total rows and unique rows across all columns
            columns_quoted = ', '.join(f'"{col}"' for col in column_names)  # Quote column names
            count_query = f'SELECT COUNT(*) as total_rows, COUNT(DISTINCT ({columns_quoted})) as unique_rows FROM "{table_name}"'

            # Execute the query and handle any errors
            _query_result, _error_message, _traceback_string = utils.queries.get_query_result(dlt_pipeline, count_query)

            if _error_message:
                data.append({"Table Name": table_name, "Total Rows": "Error", "Unique Rows": "Error"})
            else:
                row_count_info = _query_result.iloc[0]
                data.append({
                    "Table Name": table_name,
                    "Total Rows": row_count_info['total_rows'],
                    "Unique Rows": row_count_info['unique_rows']  # Count of distinct rows
                })

    # Prepare the result in a tabular format to display
    if data:
        basic_data_checks_table = utils.ui.dlt_table(data)

    # Display the table with a title
    mo.vstack([
        mo.md("### Basic Data Checks"),
        basic_data_checks_table
    ]) if data else None
    return
Once you have the local version, you can also use the regular marimo commands to run or edit this notebook. This way, you can maintain multiple versions of your dashboard or other marimo apps in your project:
# this will run a local dashboard
marimo run dlt_dashboard.py

# this will run the marimo in edit mode
marimo edit dlt_dashboard.py
Further reading
If you are running dlt in Python interactively or in a notebook, read the Accessing loaded data in Python guide.